Shortcut case study

Iteration Insights

Data visualization · Reporting UX · User testing

A redesign of Shortcut's iteration reporting helped users find key insights at a glance through clearer, more trustworthy visual signals.

  • Role

    Lead Product Designer

  • Scope

    User research, data visualization, reporting UX, interaction design

Overview

Teams use iterations to plan and track work. I led a redesign of iteration reporting to make status clear at a glance and to improve usefulness and accessibility of the data. I conducted user interviews to identify key pain points, then designed and tested new patterns in close collaboration with engineering to ensure the designs were feasible and well-aligned with the underlying data.

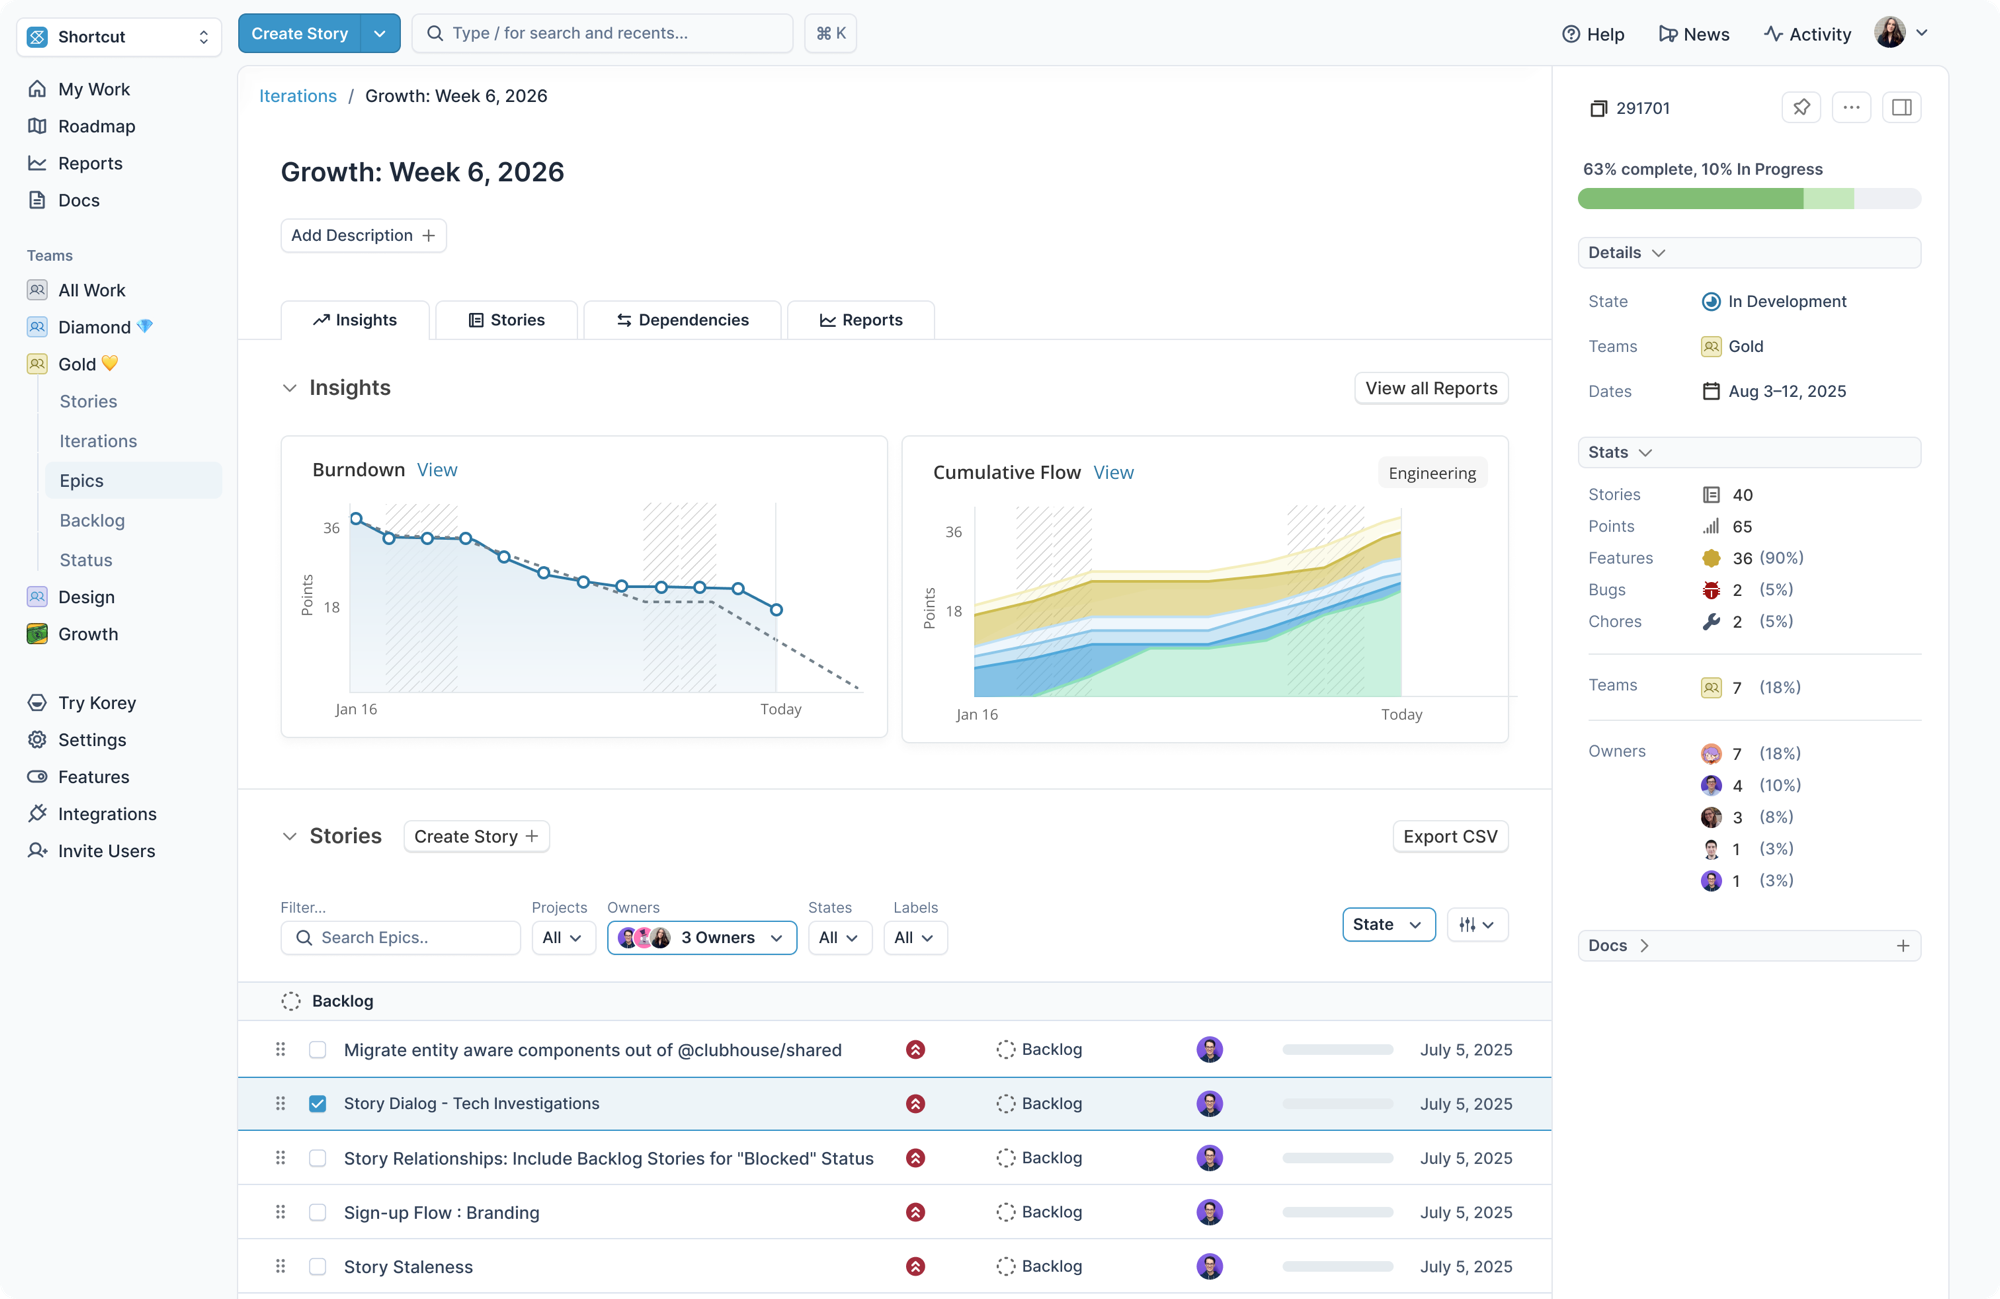
Iteration reporting after redesign
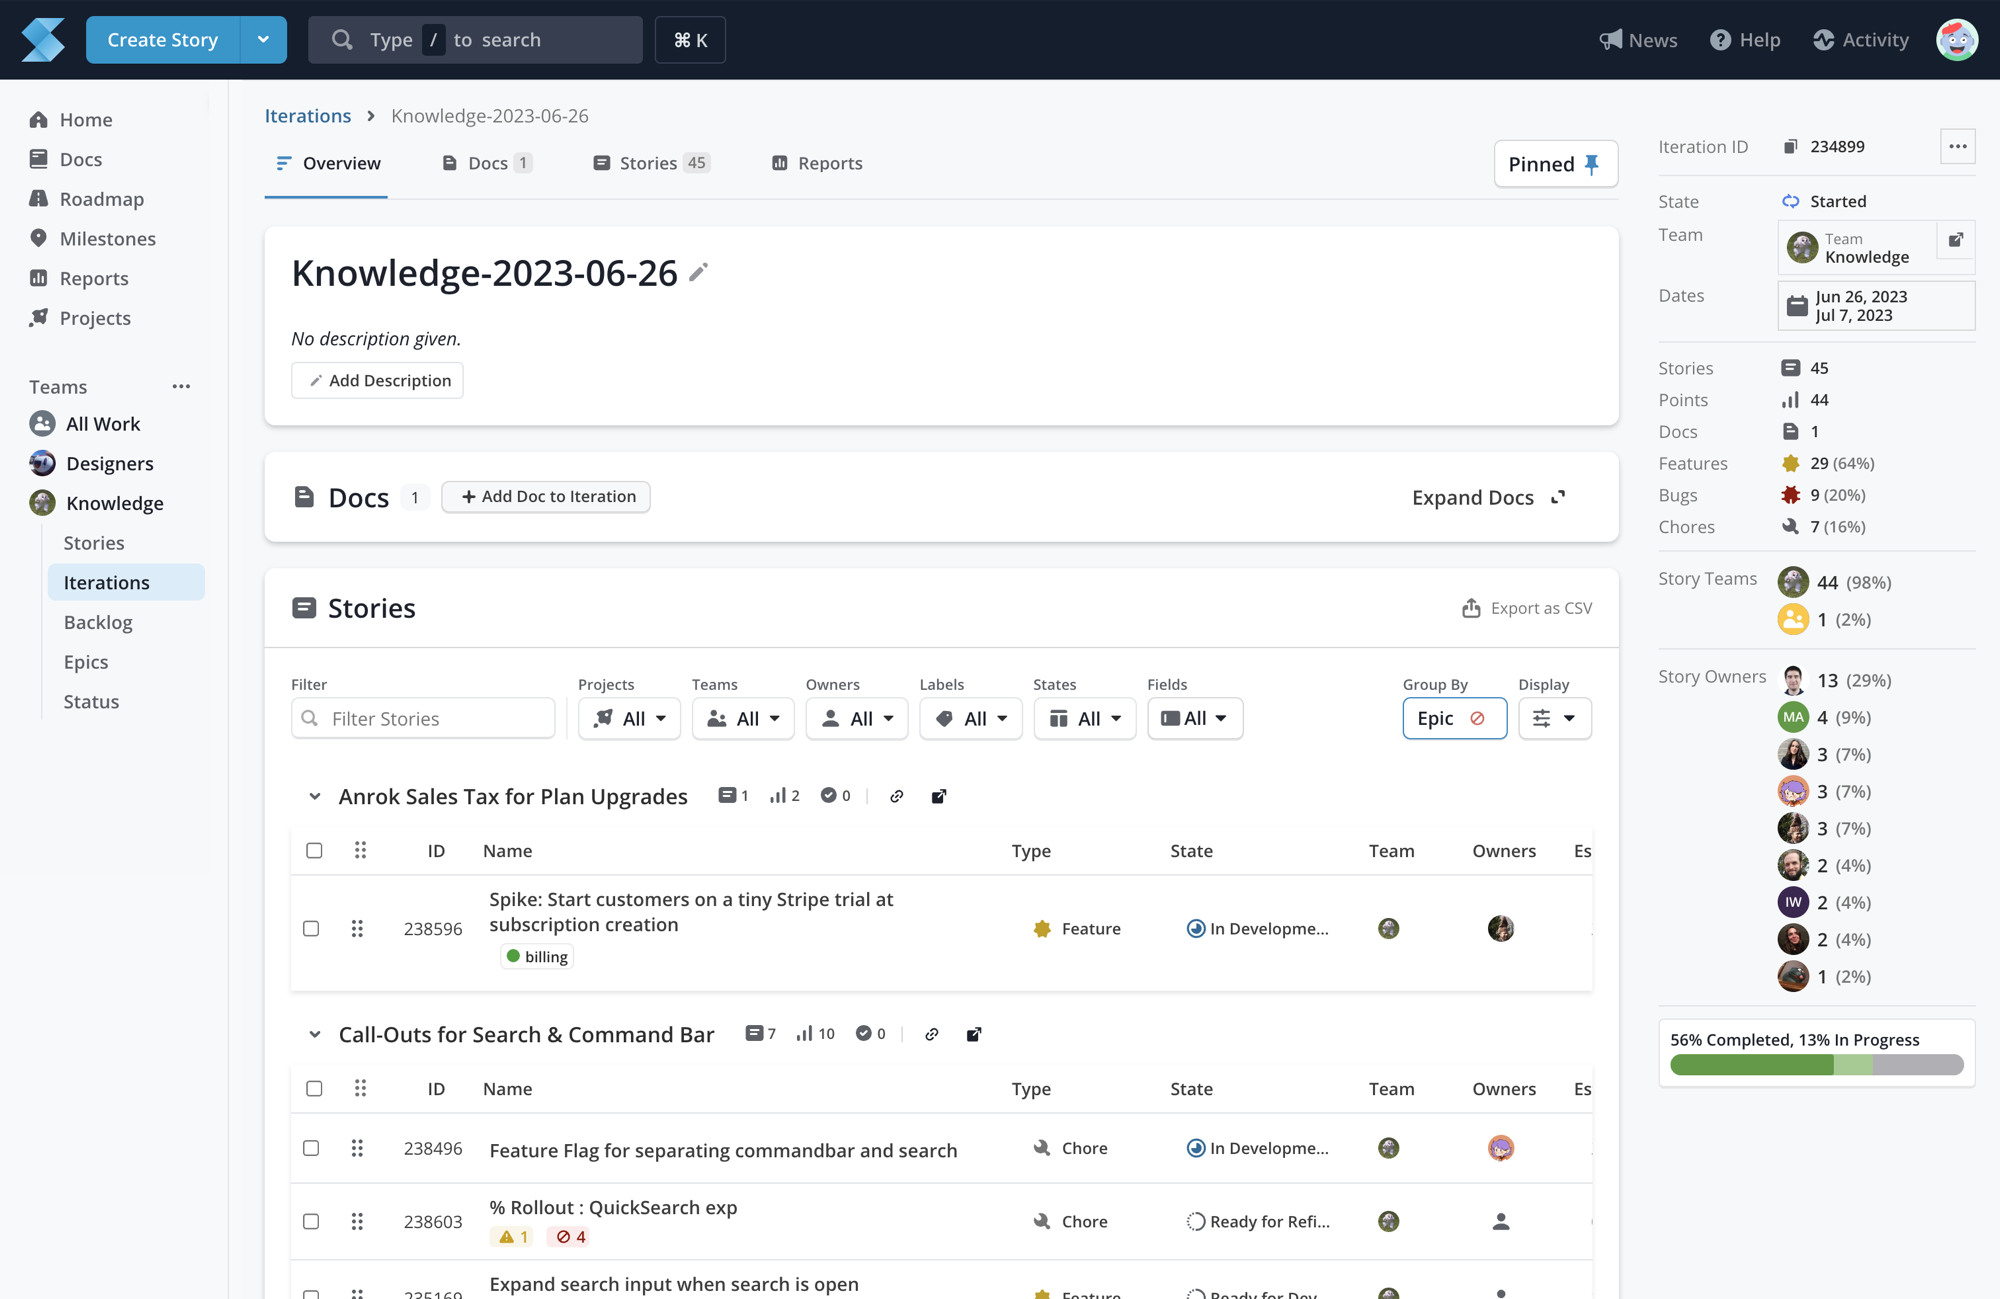
Iteration reporting before redesign
Before After

Part 1

Surface Key Insights

The iteration page was a long, undifferentiated scroll of content. It lacked proper wayfinding, with status and insights buried in charts at the bottom of the page. I restructured the page to surface key information and make it easier to navigate page content.

Part 2

Reports Redesign

Iteration reports needed a complete overhaul to make them more scannable, insightful, and trustworthy. Each report was redesigned with a specific question in mind: what is a user trying to learn when they open this view?

User Research

Before starting design, I paired with a user researcher to conduct interviews with 6 long-time Shortcut customers spread across the product and engineering spectrum. We sought to understand how users interacted with the existing reports, what insights they were trying to glean, and what pain points they encountered.

Once I had a working prototype, we ran moderated testing with the initial research group and unmoderated tests with additional users sourced through UserResearch.com. The feedback from testing led to specific design changes that made the charts more intuitive and insightful.

Burndown Chart

The previous version of the burndown chart was non-standard. In user interviews, we learned that users sought other tools for a classic burndown view.

I redesigned the burndown to align with user expectations while also adding features they found missing in other renditions. The new design made it easier to understand progress and deviation from plan at a glance, with a movable ideal line that provided a new way to understand trajectory mid-iteration.
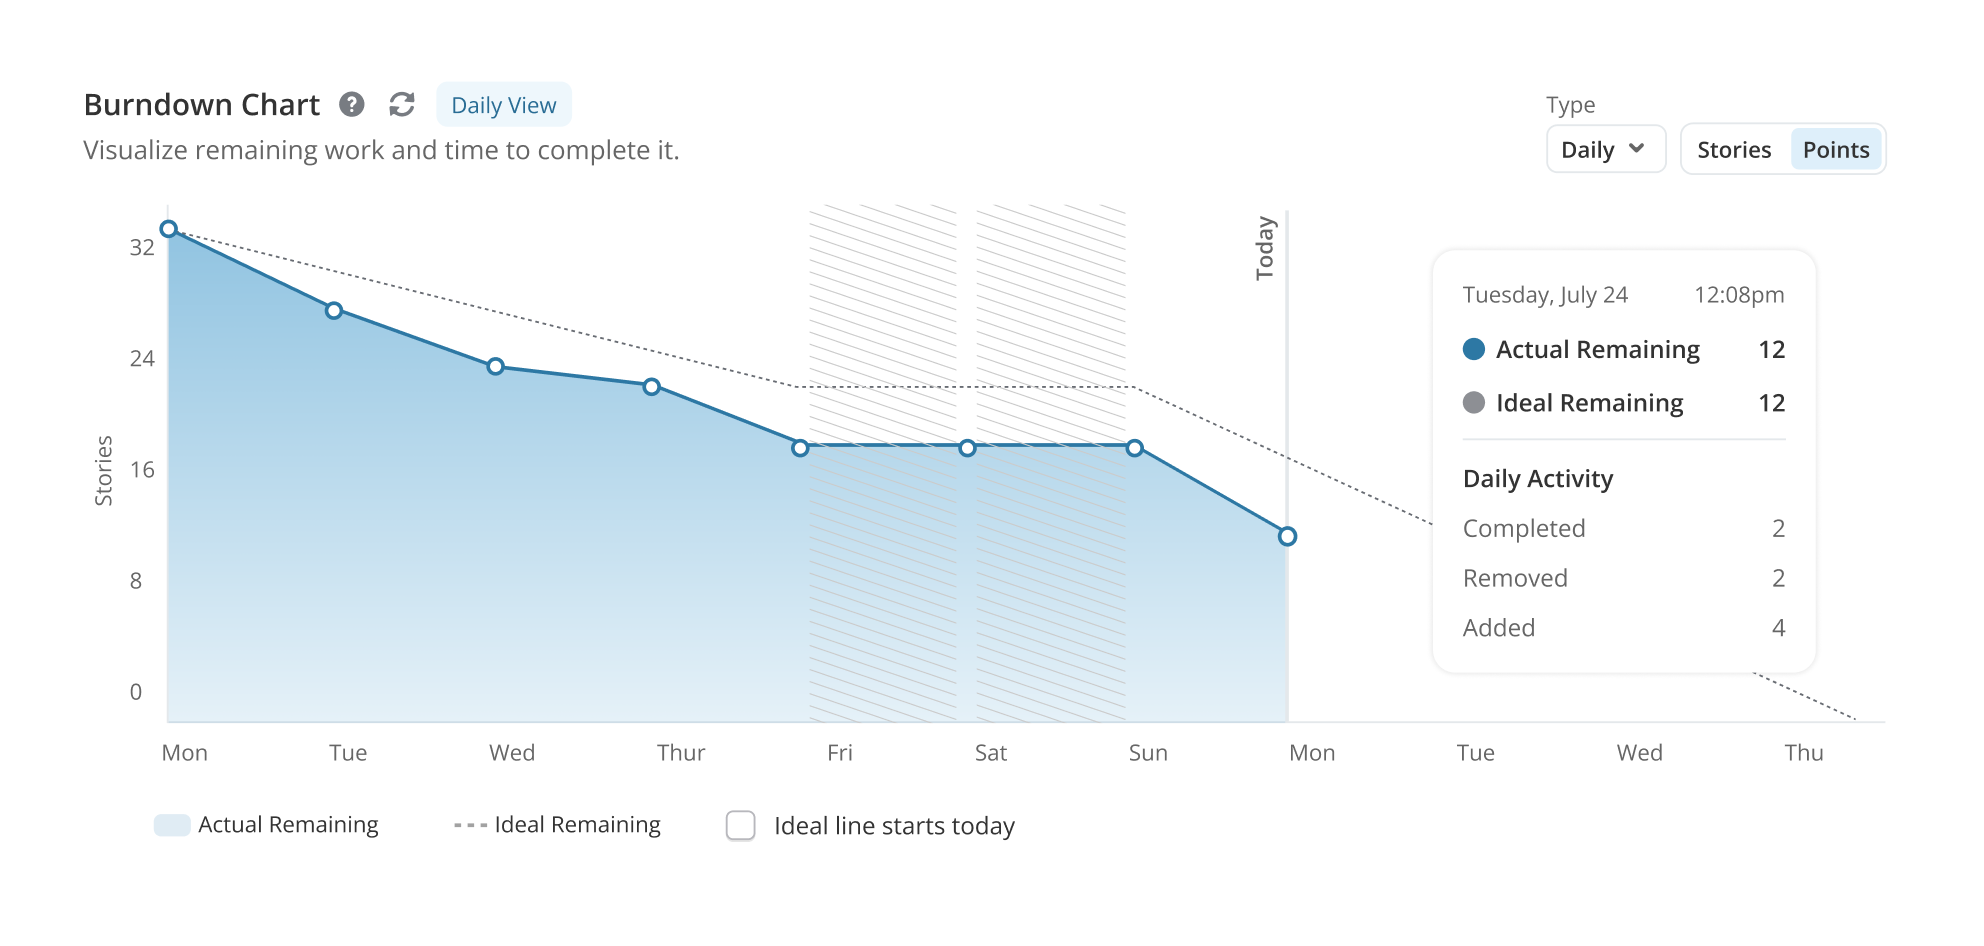
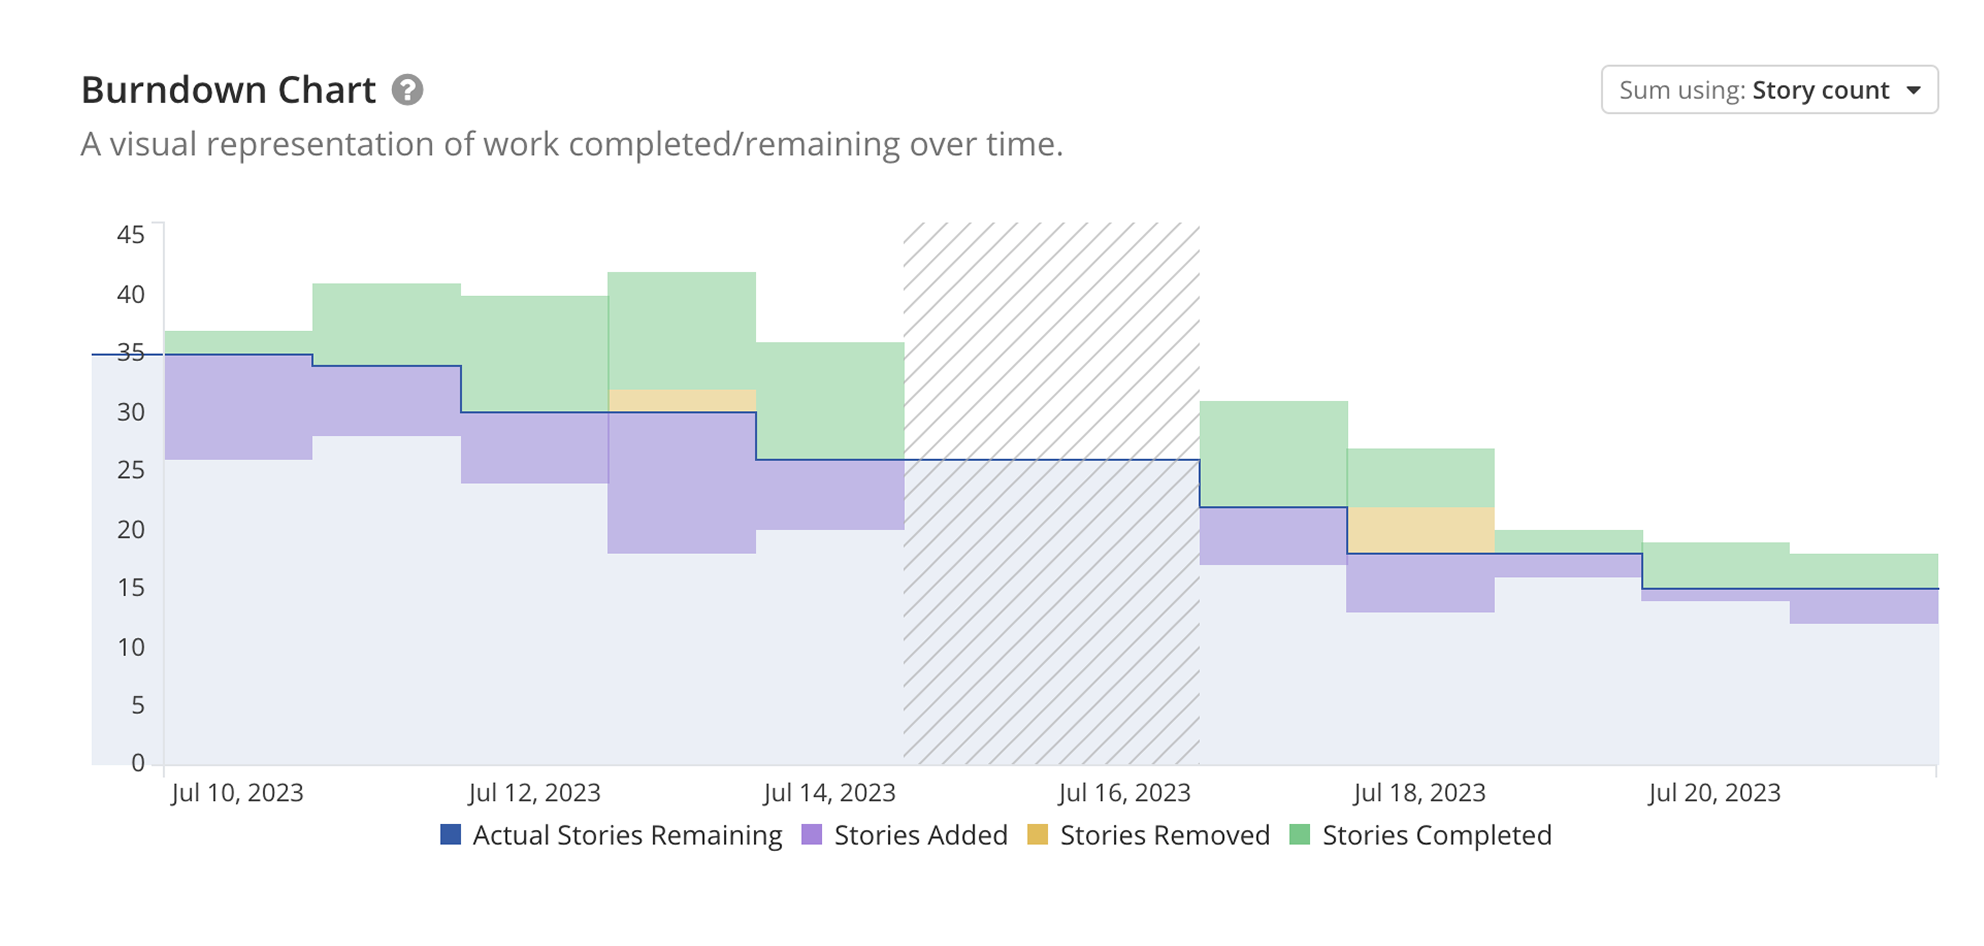
Burndown chart redesign
Burndown chart redesign before
Before After

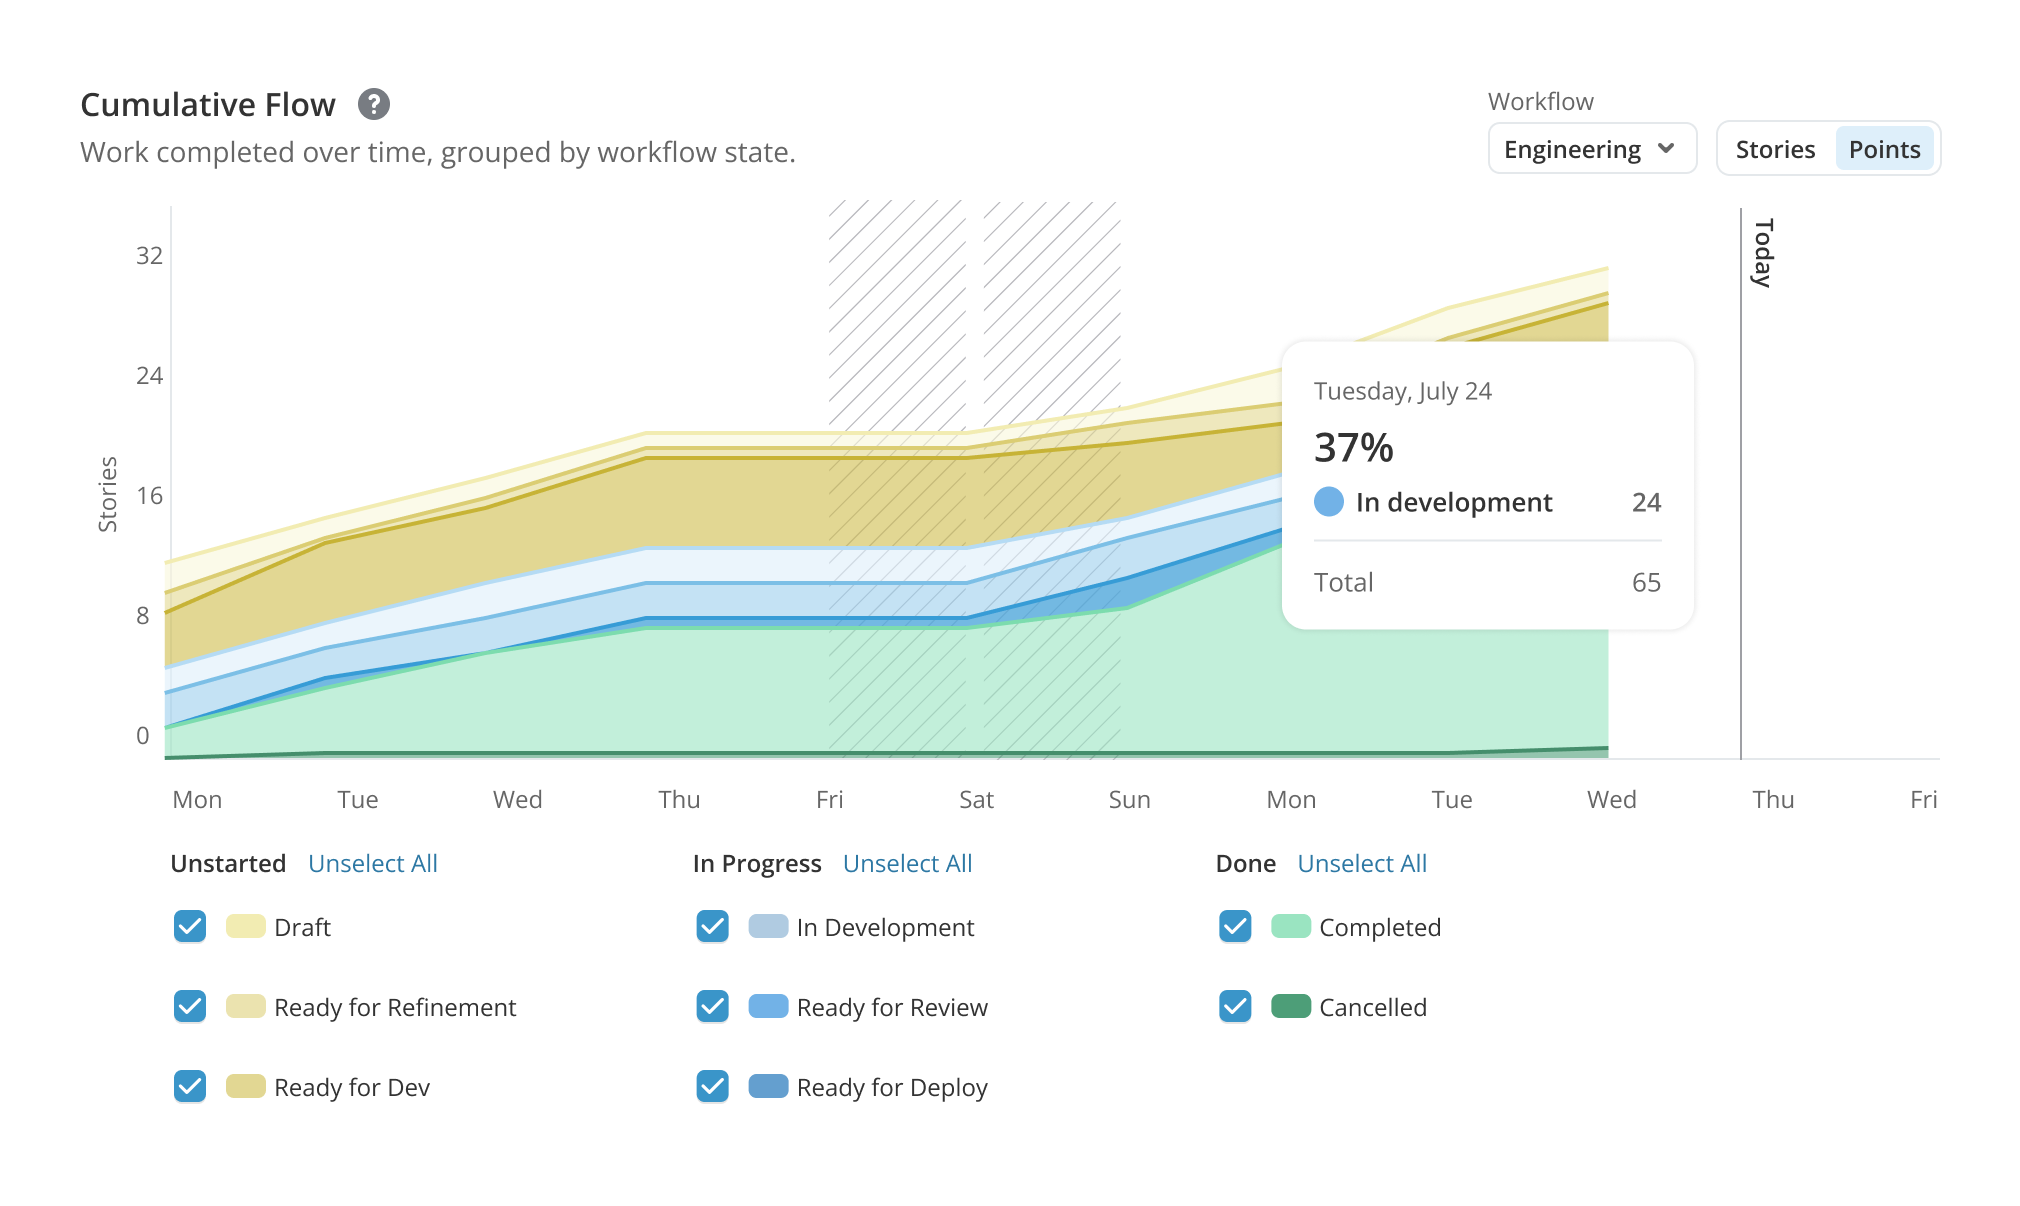
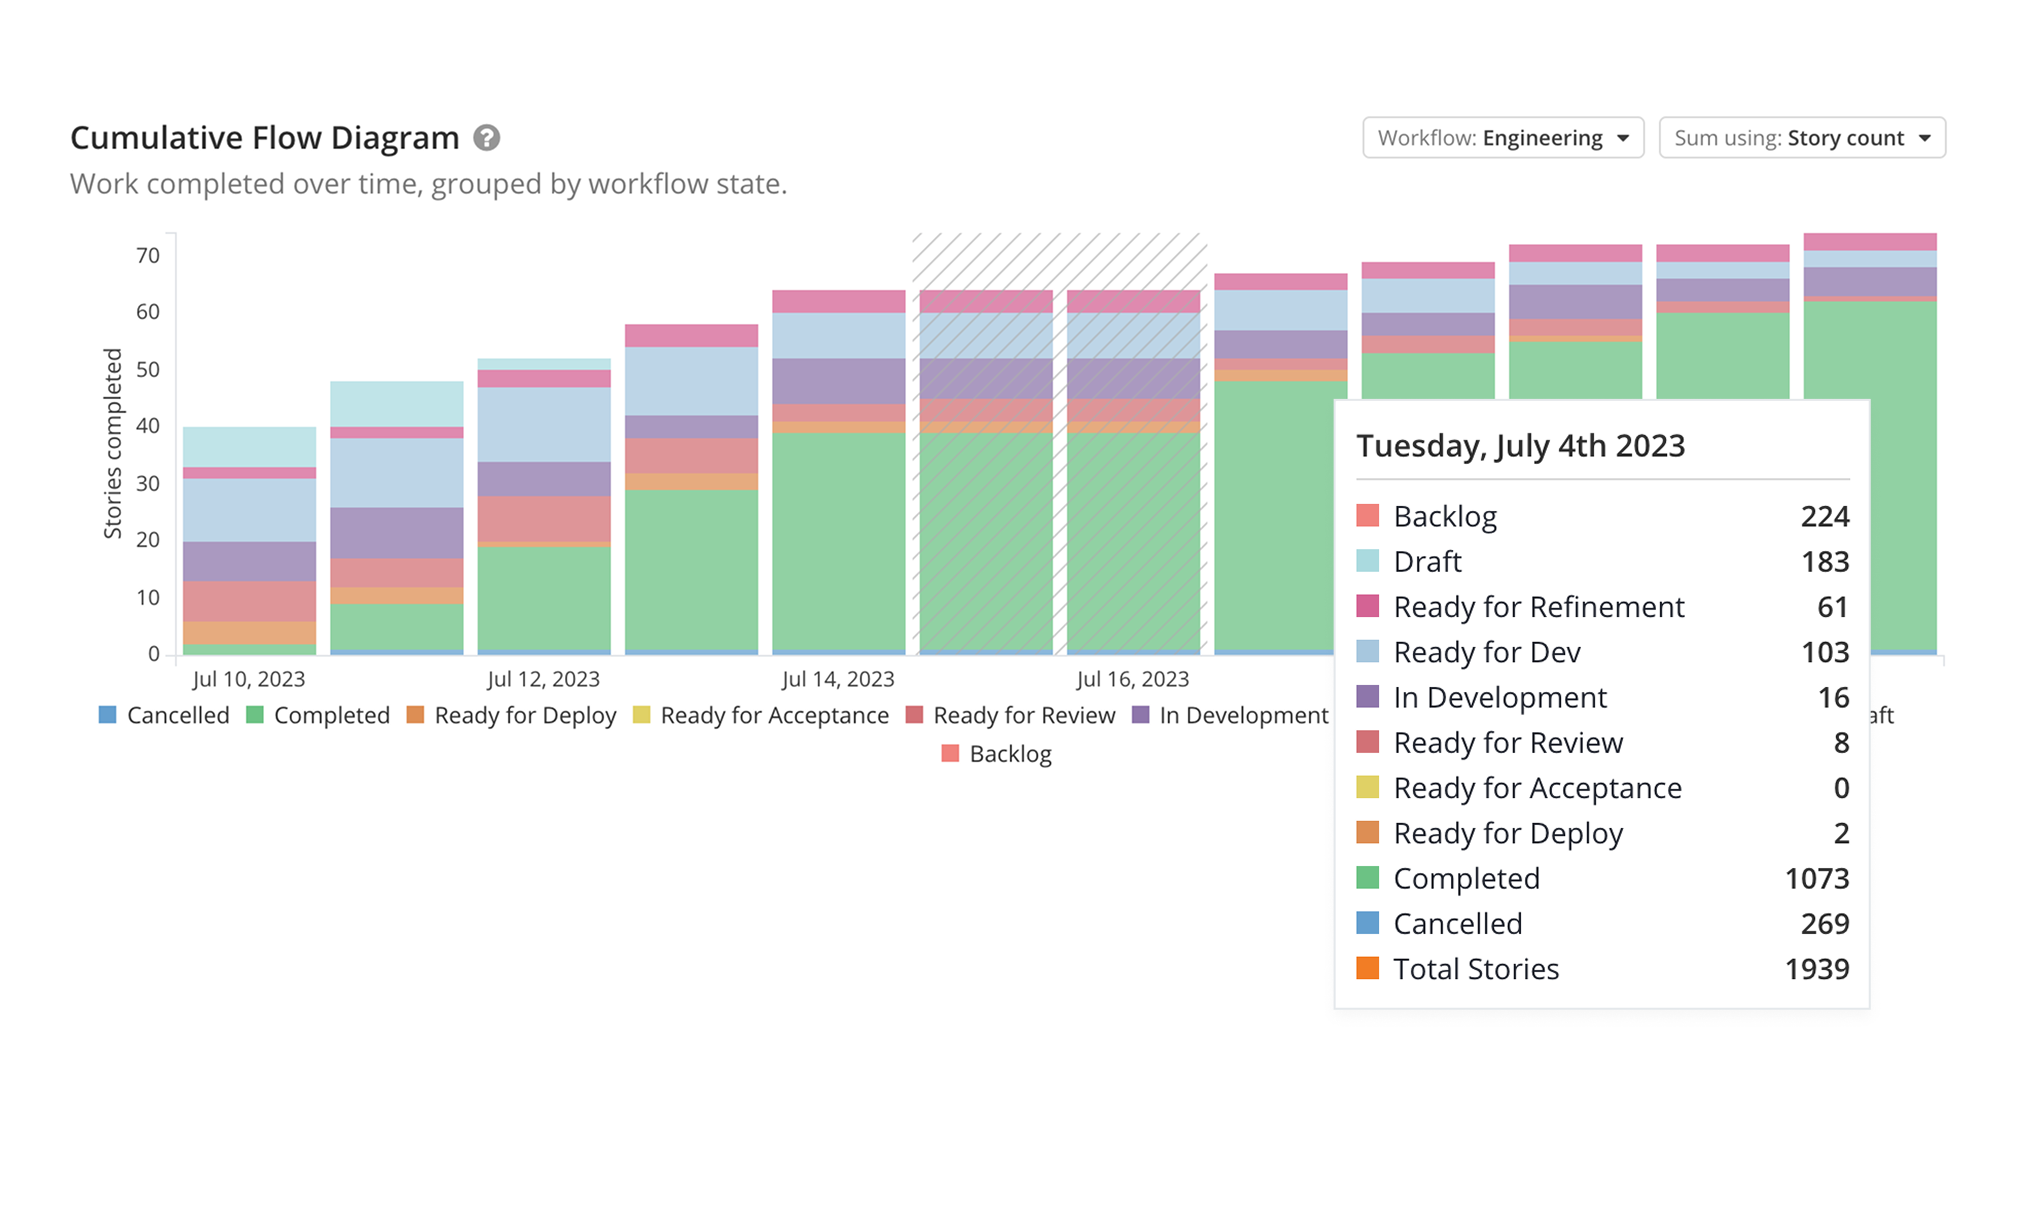
Cumulative Flow Diagram

We learned from users that they struggled with the existing CFD, finding it difficult to identify patterns at a glance or see detailed information about specific workflow states.

I redesigned the chart with color bands that matched existing state signals and a clear legend that allowed users to focus on specific states. The tooltip was redesigned to show detailed state data for each band. The resulting design made it easier to understand flow patterns, identify bottlenecks, and track specific states over time.

Cumulative flow diagram redesign
Cumulative flow diagram redesign before
Before After

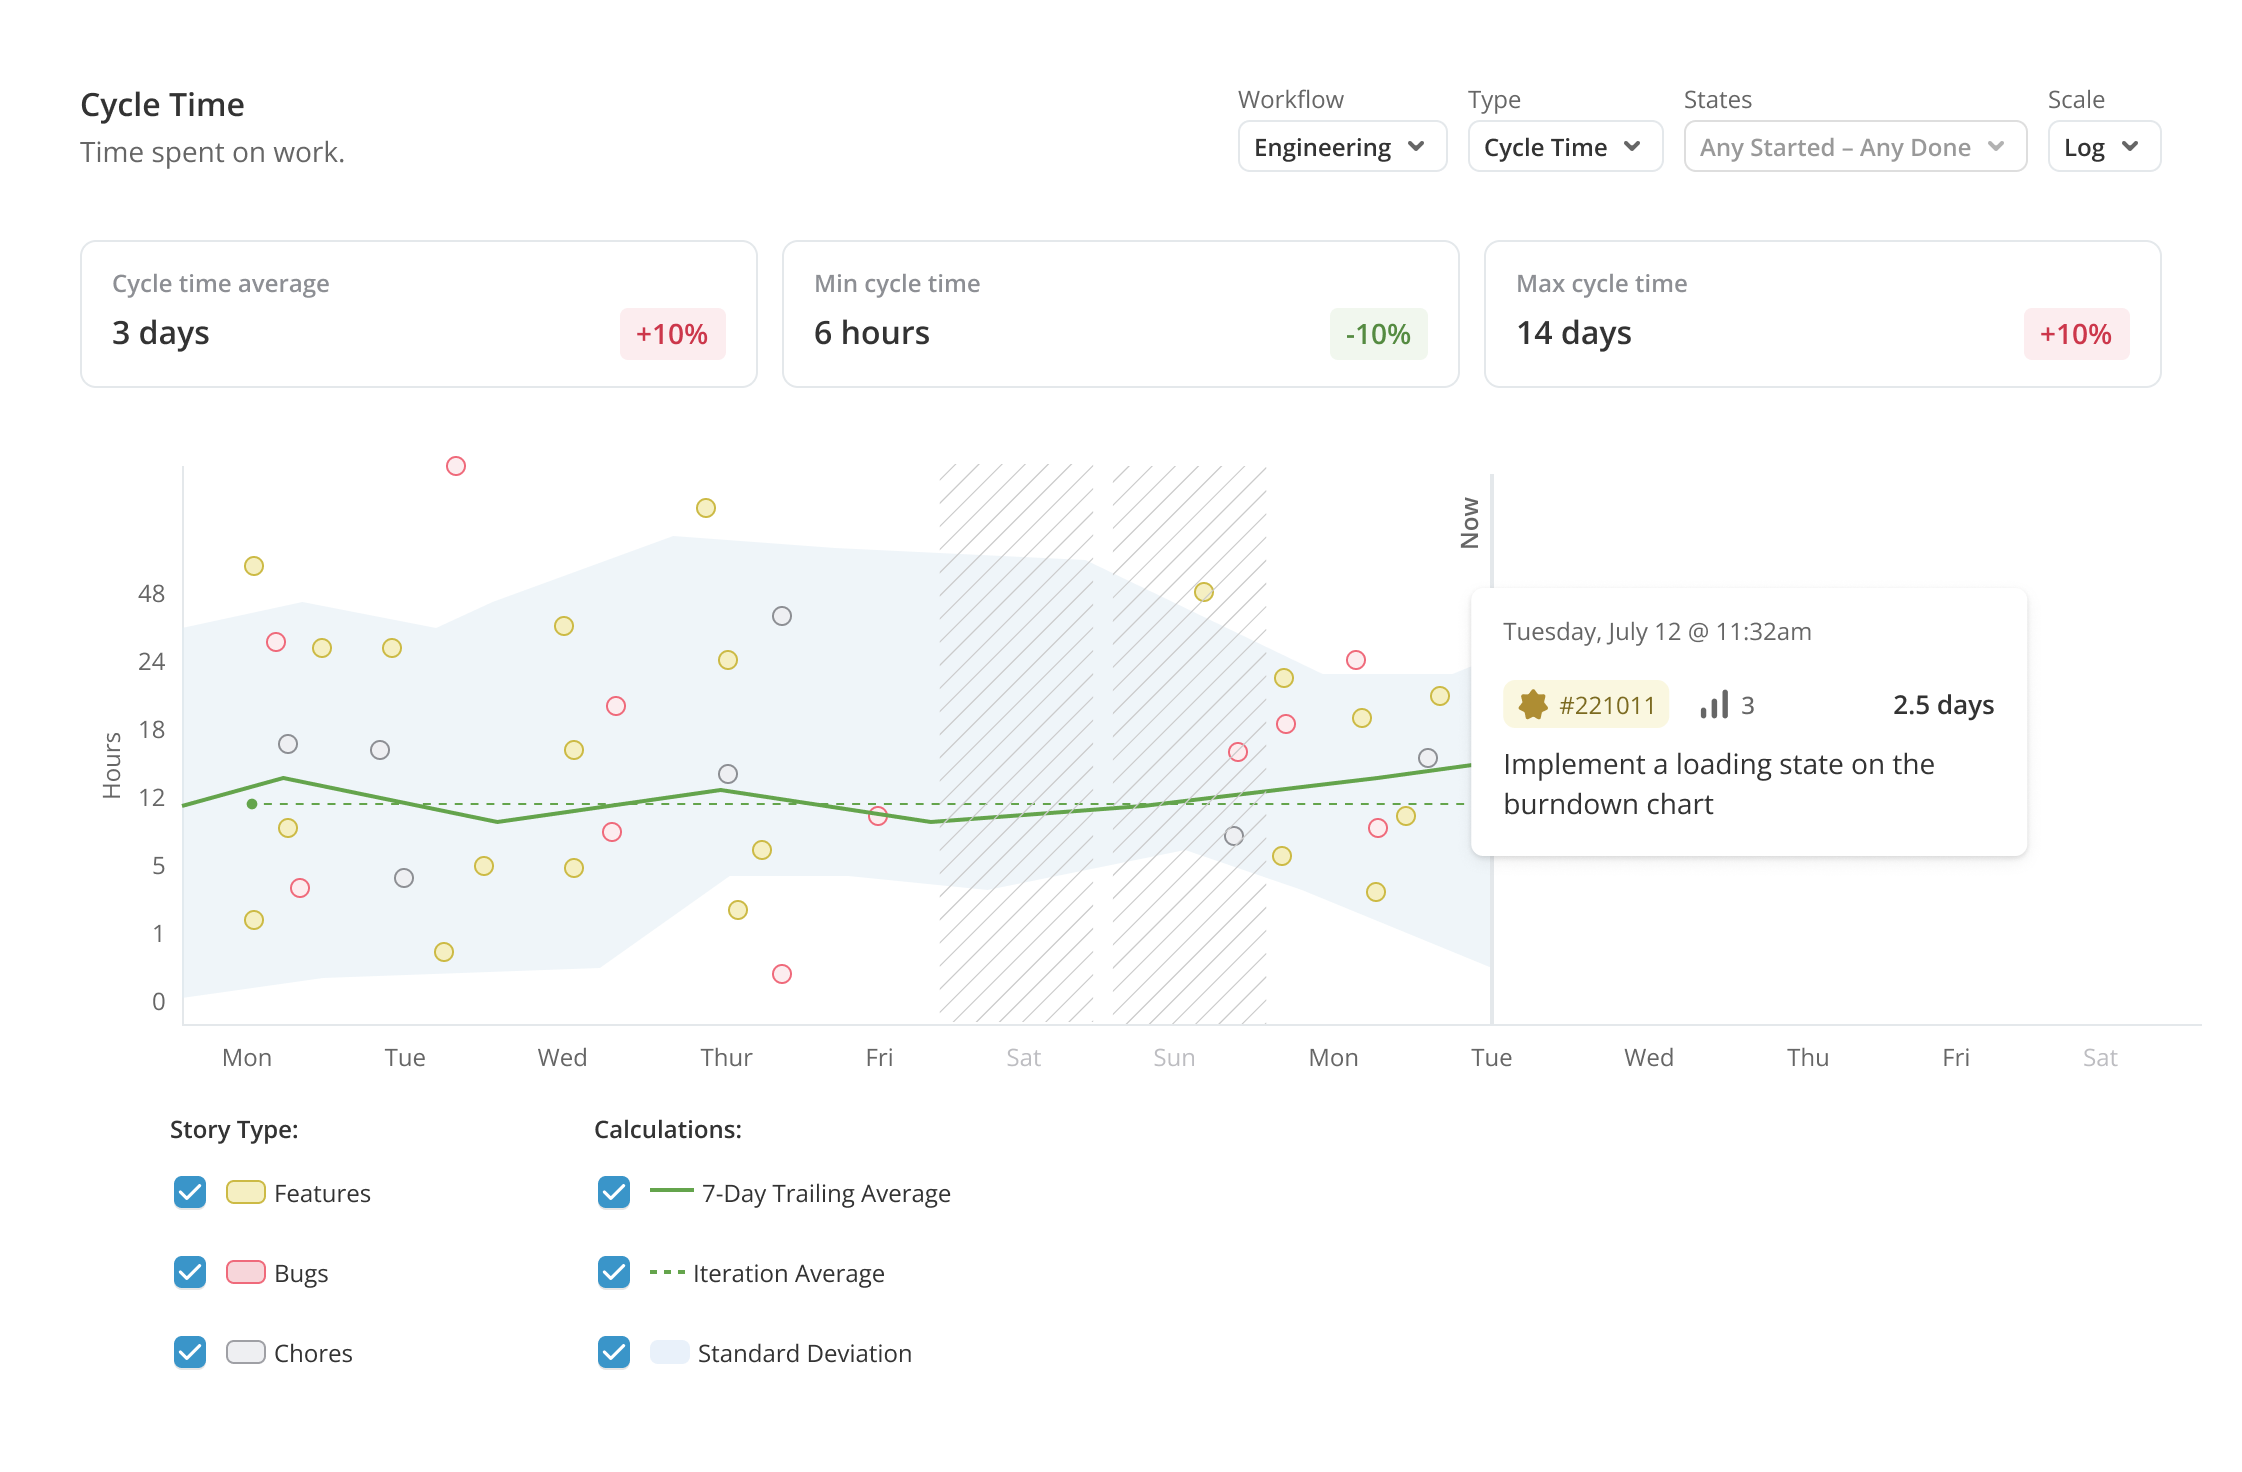
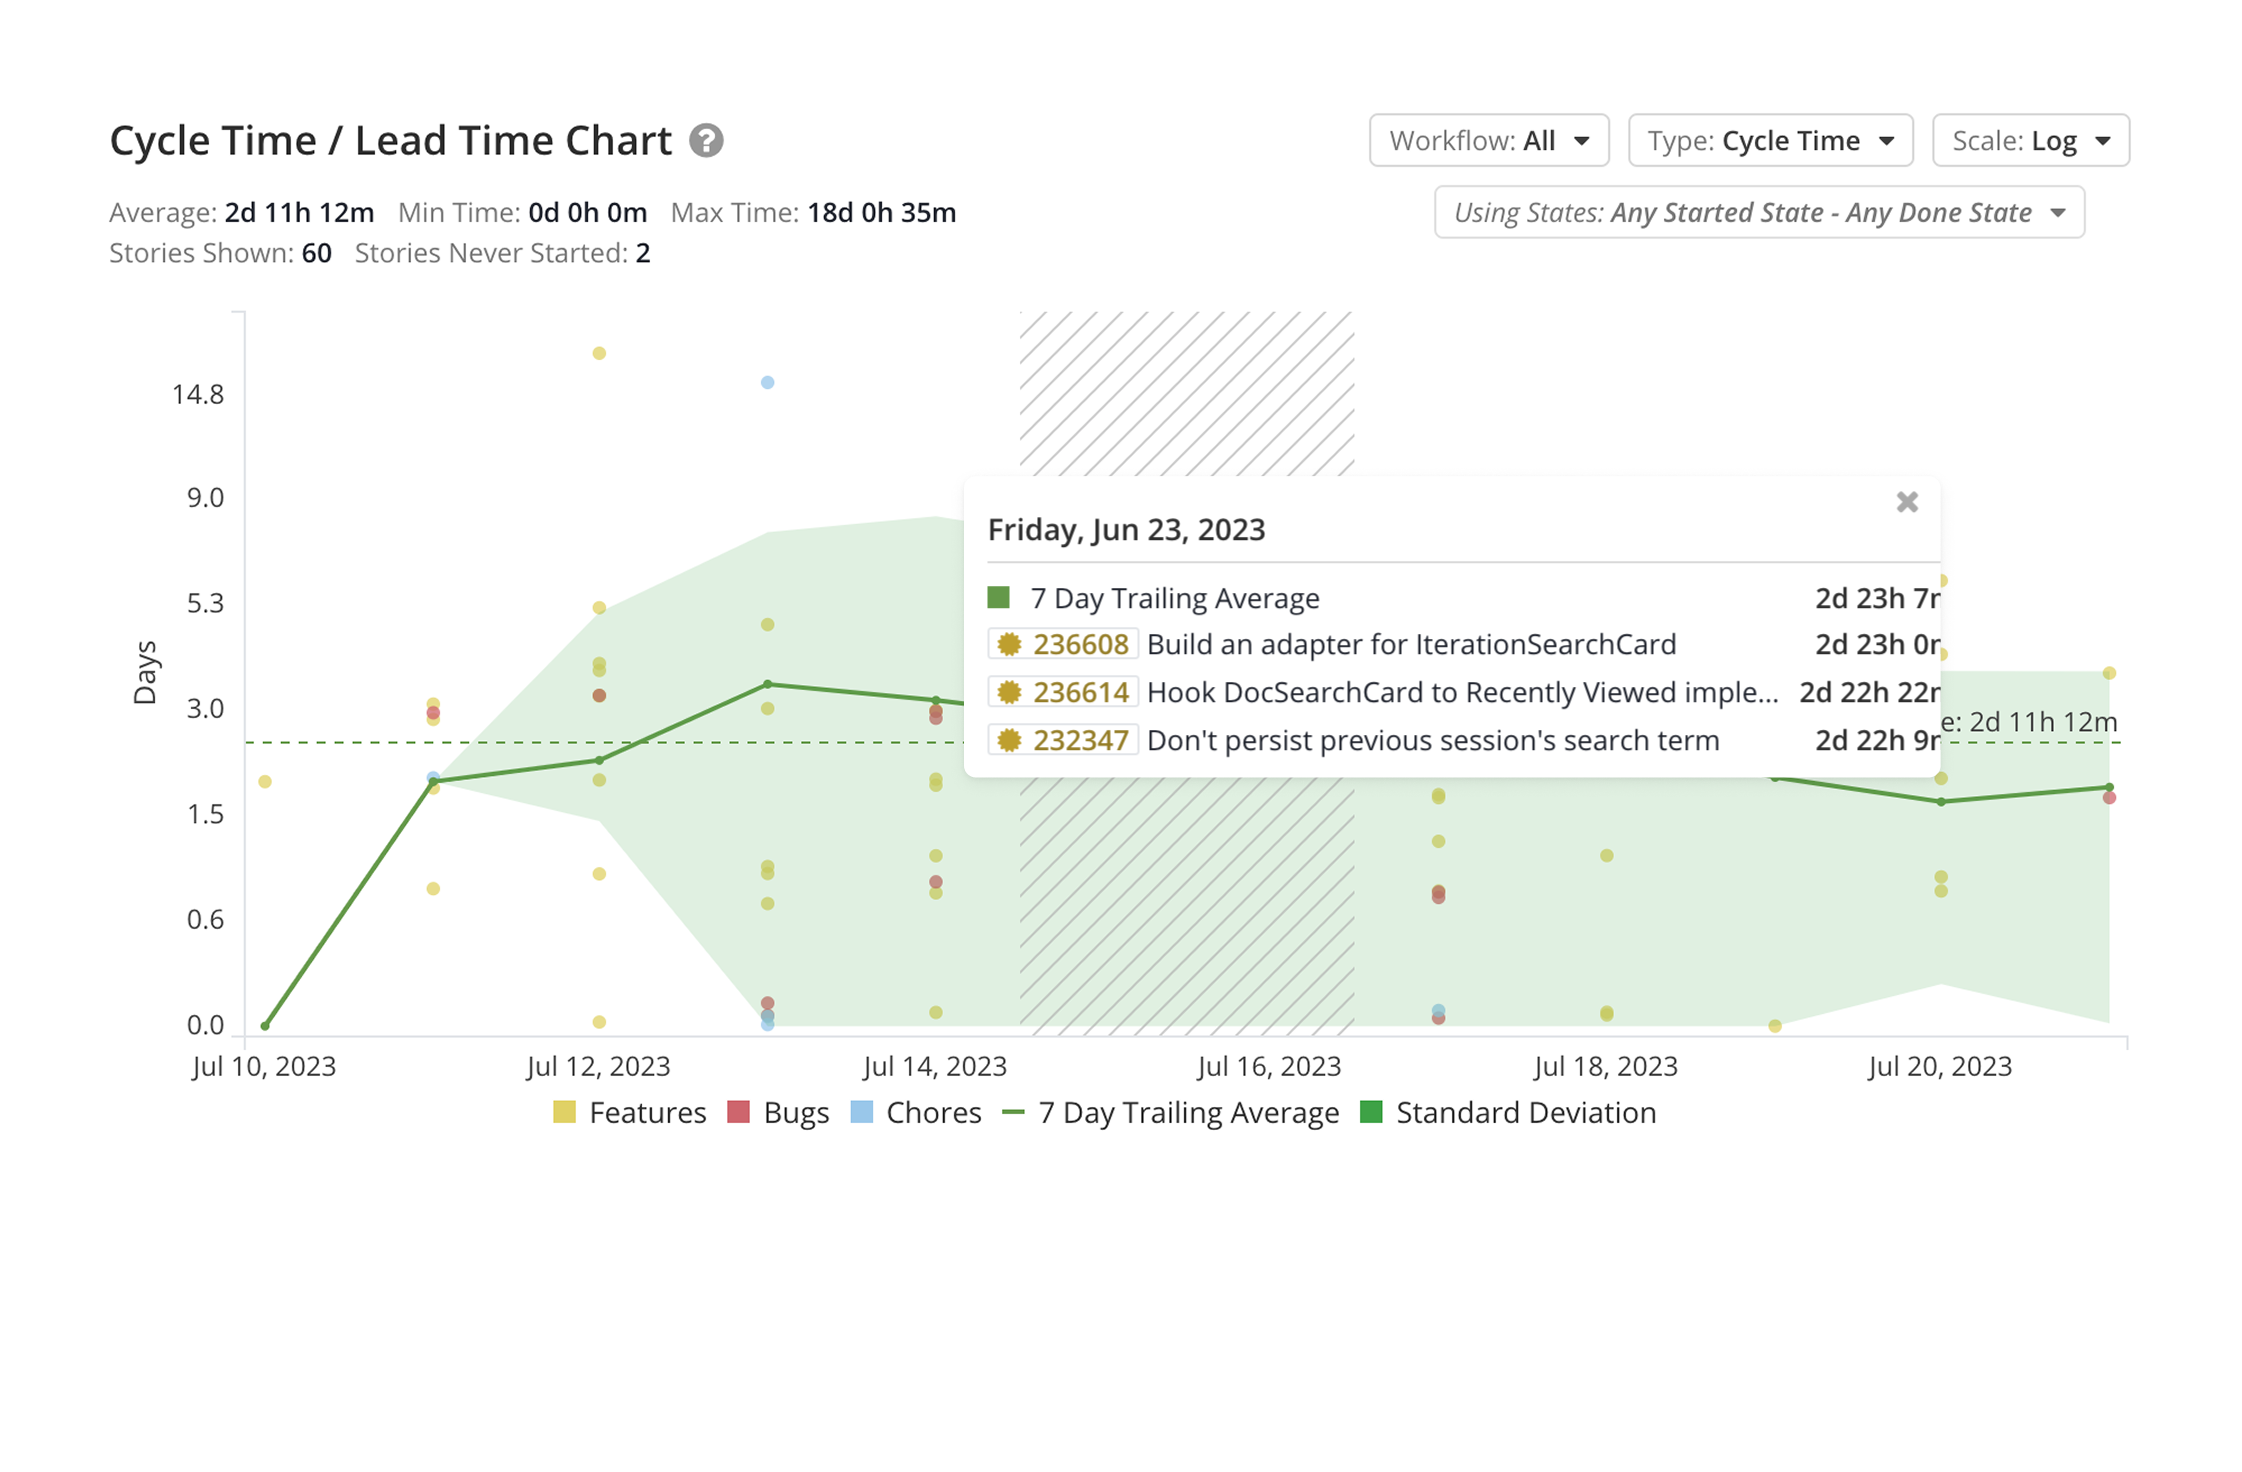
Cycle Time / Lead Time

I redesigned the cycle time report to see a more accurate distribition of data, provide easier access into individual data points, and show clear trends and insights.

Cycle time and lead time redesign
Cycle time and lead time redesign before
Before After

Part 3

What didn't ship

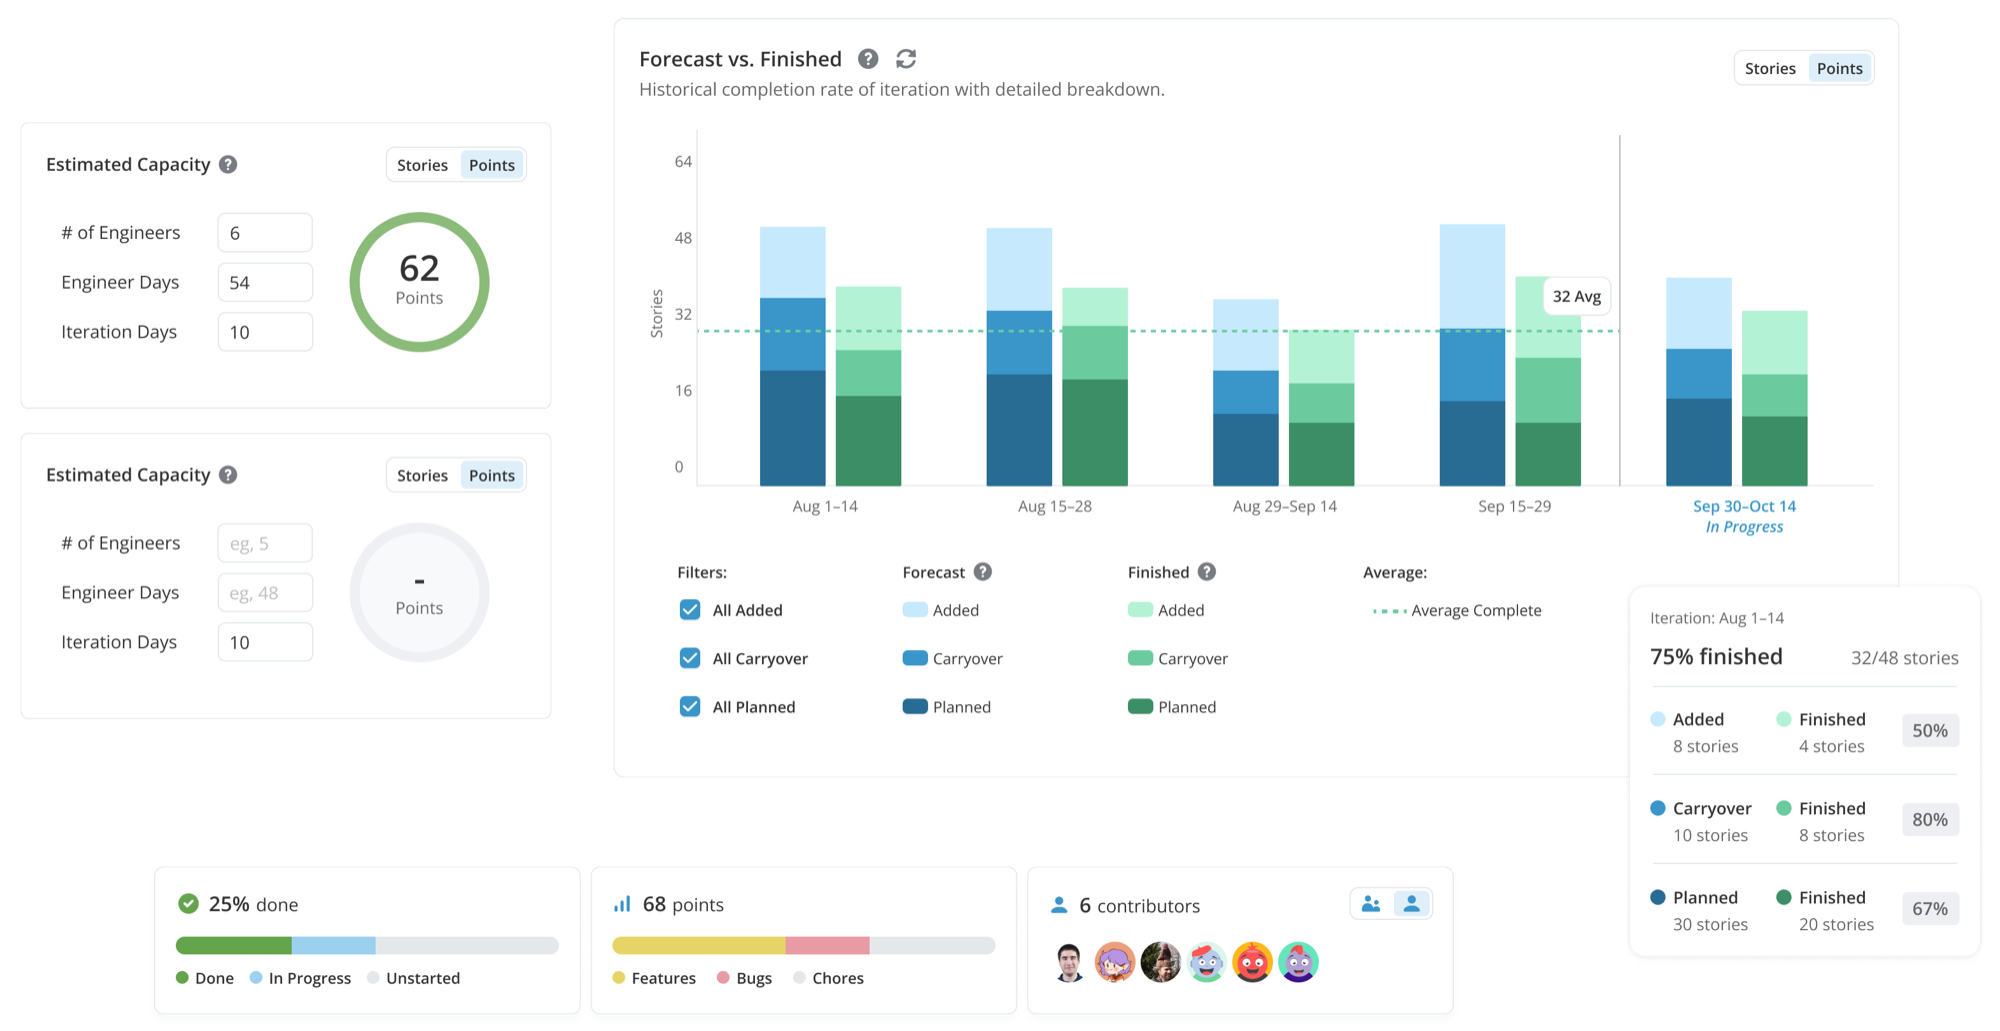
The timeline for this project was tight, and some features I designed didn't make it into the final release. The most significant of these was a new report that surfaced a historical comparison of work forecast vs. finished for each iteration. This allowed teams to see trends and better plan based on actual past delivery. While this report was well-received in testing, it was ultimately cut to meet the project timeline. I hope to revisit this design in a future iteration of the product.

What didn't ship

Engineering Collaboration

The visual design was only part of the challenge. I worked closely with engineering to figure out the underlying data structure, datetime handling across charts, and filtering behavior — decisions that shaped what was even possible to show and how accurately it could be shown.

Outcome

The redesigned iteration experience now surfaces key insights at a glance, making trajectory, bottlenecks, and delivery health accessible and trustworthy.